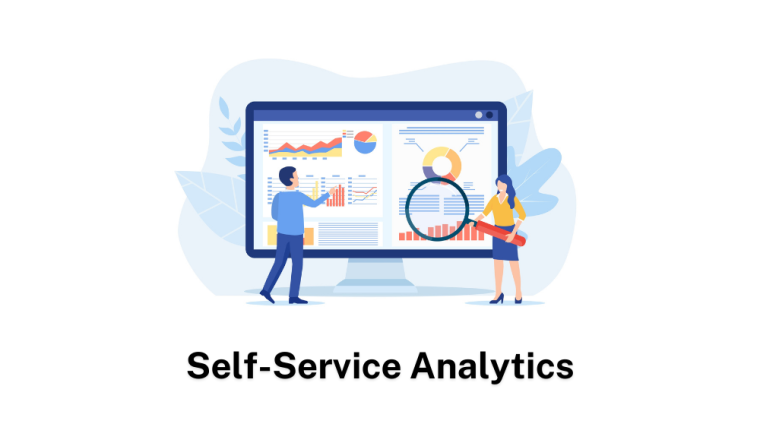
This course equips participants with practical knowledge and tools to independently access, analyze, and visualize data for informed decision-making without relying heavily on technical teams. It focuses on self-service Business Intelligence (BI) frameworks, data preparation, dashboard development, reporting automation, and data storytelling. Participants will gain hands-on skills in using BI and analytics tools to explore trends, monitor performance, and generate actionable insights across business functions.
Target Groups
- Business analysts and reporting officers
- Monitoring and evaluation professionals
- Finance and operations teams
- Department managers and team leads
- Data analysts and BI practitioners
- Project managers and coordinators
- Strategy and performance management teams
- Public sector and NGO professionals
- Anyone responsible for data-driven reporting and decision-making
Course Objectives
By the end of this course, participants will be able to:
- Understand self-service BI and analytics concepts
- Access and prepare data from multiple sources
- Build interactive dashboards and reports
- Analyze trends and key performance indicators
- Apply data visualization best practices
- Use BI tools for independent reporting and analysis
- Automate recurring reports and dashboards
- Interpret analytics to support business decisions
- Communicate insights through effective data storytelling
- Promote a data-driven culture across teams and departments
Course Modules
Module 1: Introduction to Self-Service BI & Analytics
- Overview of self-service BI and analytics
- Benefits of decentralized reporting and analysis
- Key BI concepts and terminology
- Self-service analytics vs traditional reporting
- Roles and responsibilities in BI adoption
Module 2: Data Sources and Data Preparation
- Identifying and connecting data sources
- Importing spreadsheets, databases, and cloud data
- Cleaning and transforming data
- Data validation and quality checks
- Preparing datasets for reporting and analysis
Module 3: BI Tools and Dashboard Development
- Overview of self-service BI platforms
- Designing dashboards and scorecards
- Interactive reports and drill-down features
- Filters, slicers, and user controls
- Dashboard usability and accessibility
Module 4: Data Visualization Best Practices
- Selecting the right charts and graphs
- Visual hierarchy and dashboard layout
- Designing for clarity and usability
- Common data visualization mistakes
- Visual storytelling techniques
Module 5: Analytics and Performance Measurement
- Defining KPIs and business metrics
- Trend and variance analysis
- Benchmarking and comparative analysis
- Forecasting basics and scenario planning
- Performance monitoring frameworks
Module 6: Self-Service Reporting and Automation
- Creating reusable report templates
- Automating scheduled reports
- Sharing reports securely across teams
- Notifications and alerts in BI systems
- Managing report updates and versions
Module 7: Data Analysis and Decision Support
- Exploring patterns and trends
- Root cause analysis techniques
- Business decision support through analytics
- Identifying opportunities and risks
- Translating insights into action plans
Module 8: Governance, Security and Data Access
- Data governance for self-service BI
- Access controls and permissions
- Data privacy and compliance requirements
- Managing shared datasets
- Ensuring consistency across reports
Module 9: Collaboration and Data Storytelling
- Presenting findings to stakeholders
- Building compelling narratives with data
- Collaborative analytics and team dashboards
- Encouraging adoption across departments
- Decision-making using data insights
Module 10: Capstone Project and Case Studies
- Building an interactive BI dashboard from real datasets
- Self-service analytics case study
- KPI reporting and executive dashboard exercise
- Dashboard presentation and peer review
- Emerging trends in augmented analytics, AI-assisted dashboards, real-time reporting, mobile BI, and enterprise self-service analytics