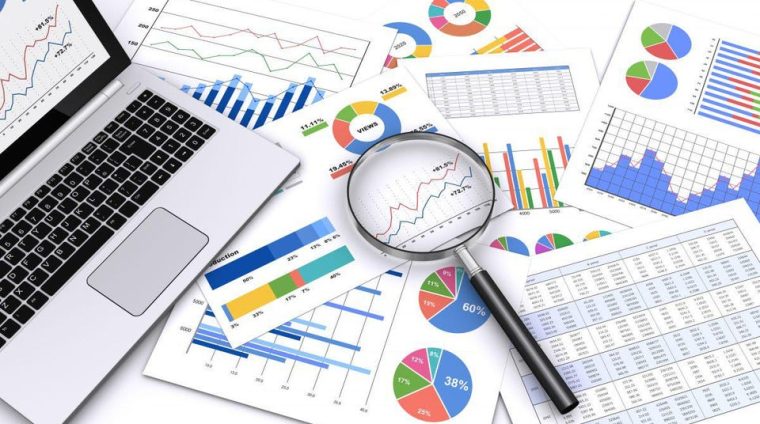
This course equips participants with the knowledge and practical skills required to use key software tools for monitoring and evaluation (M&E) data management, analysis, and reporting. It focuses on data entry, cleaning, statistical analysis, visualization, and interpretation using Excel, SPSS, and Stata. Participants will learn how to transform raw M&E data into meaningful insights for decision-making, reporting, and program improvement.
Target Groups
- Monitoring and evaluation officers
- Data analysts and statisticians
- Program and project managers
- NGO and donor-funded project staff
- Public sector planning and research officers
- Health and social program officers
- Academic researchers and students
- Development practitioners and consultants
Course Objectives
By the end of this course, participants will be able to:
- Understand the role of software tools in M&E systems
- Use Excel for data entry, cleaning, and basic analysis
- Apply SPSS for statistical analysis and reporting
- Use Stata for advanced data management and econometric analysis
- Develop indicators and performance tracking systems using software tools
- Perform descriptive and inferential statistical analysis
- Create dashboards and visual reports for decision-making
- Ensure data quality, accuracy, and consistency in datasets
- Interpret analytical outputs for program evaluation
- Strengthen evidence-based reporting and decision-making
Course Modules
Module 1: Introduction to M&E Software Tools
- Overview of M&E data management systems
- Role of software in monitoring and evaluation
- Comparison of Excel, SPSS, and Stata
- Data workflow in M&E systems
- Choosing the right tool for analysis tasks
Module 2: Microsoft Excel for M&E Data Management
- Data entry and spreadsheet structuring
- Data cleaning and validation techniques
- Use of formulas and functions for analysis
- Pivot tables and summary reports
- Data visualization using charts and graphs
- Using Microsoft Excel for M&E tracking, KPI monitoring, and reporting dashboards
Module 3: Introduction to SPSS for M&E Analysis
- SPSS interface and data setup
- Data coding and variable definition
- Descriptive statistics and frequency analysis
- Cross-tabulation and chi-square tests
- Data transformation and recoding
- Generating statistical reports and outputs
Module 4: Advanced SPSS Analysis Techniques
- Correlation and regression analysis
- ANOVA and hypothesis testing
- Reliability and validity testing
- Creating graphs and statistical visualizations
- Exporting and reporting results effectively
Module 5: Introduction to Stata for M&E
- Stata interface and data management basics
- Importing and cleaning datasets
- Data manipulation and variable creation
- Descriptive and summary statistics
- Basic command structure and syntax
Module 6: Advanced Stata Analysis
- Regression and econometric modeling
- Panel data and time-series analysis
- Data merging and restructuring
- Hypothesis testing in Stata
- Producing publication-ready outputs
Module 7: Data Visualization and Reporting
- Principles of effective data visualization
- Creating dashboards for M&E reporting
- Comparative and trend analysis charts
- Reporting formats for stakeholders and donors
- Translating outputs into actionable insights
Module 8: Data Quality Management in Software Tools
- Identifying and correcting data errors
- Managing missing data and outliers
- Ensuring consistency across datasets
- Data validation techniques in software tools
- Strengthening data integrity in M&E systems
Module 9: Integrating Software Tools in M&E Systems
- Linking data collection to analysis tools
- Building end-to-end M&E data workflows
- Automating reporting processes
- Combining Excel, SPSS, and Stata in projects
- Improving efficiency in M&E operations
Module 10: Capstone Project and Case Studies
- End-to-end M&E data analysis project using all tools
- Case studies of real-world program evaluations
- Group exercises on dataset analysis and reporting
- Simulation of donor reporting and performance tracking
- Emerging trends in M&E analytics, including AI-assisted statistical analysis, automated dashboards, real-time data integration systems, predictive analytics platforms, and cloud-based evaluation ecosystems