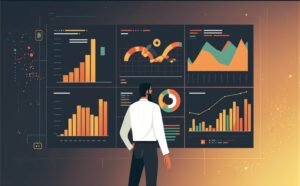
This course equips participants with the knowledge and practical skills required to design clear, effective, and decision-focused dashboards and reports for Business Intelligence (BI) environments. It focuses on data visualization principles, user-centered design, KPI structuring, storytelling with data, report standardization, dashboard usability, and performance reporting. Participants will learn how to transform complex data into simple, actionable insights that support strategic and operational decision-making.
Target Groups
- Business intelligence analysts and developers
- Data analysts and reporting officers
- Monitoring and evaluation (MEAL) professionals
- Finance and operations managers
- Strategy and planning officers
- Marketing and sales analysts
- IT and systems reporting teams
- Government data and statistics officers
- Corporate executives and decision-makers
Course Objectives
By the end of this course, participants will be able to:
- Understand principles of effective dashboard and report design
- Develop user-centered dashboards for different audiences
- Structure KPIs for clear performance tracking
- Apply data visualization best practices
- Improve clarity and usability of reports
- Design executive-level and operational dashboards
- Communicate insights through data storytelling
- Reduce complexity in reporting systems
- Standardize reporting formats across the organization
- Enhance decision-making through effective visual analytics
Course Modules
Module 1: Introduction to Dashboard and Report Design
- Role of dashboards in business intelligence
- Differences between dashboards, reports, and scorecards
- Types of dashboards (strategic, operational, analytical)
- Importance of clarity in data communication
- User expectations and decision-making needs
Module 2: Understanding Users and Reporting Requirements
- Identifying target users and stakeholders
- Requirements gathering for dashboards
- Translating business needs into reporting structures
- Defining KPIs and success metrics
- Aligning reports with decision-making processes
Module 3: Data Visualization Principles
- Choosing the right charts and graphs
- Visual hierarchy and layout principles
- Color usage and readability standards
- Avoiding misleading visual representations
- Simplifying complex datasets
Module 4: KPI Design and Performance Measurement
- Defining meaningful KPIs
- Aligning KPIs with organizational goals
- KPI grouping and categorization
- Balanced scorecard approach
- Tracking performance trends effectively
Module 5: Dashboard Structure and Layout Design
- Dashboard layout planning techniques
- Information prioritization and grouping
- Navigation and usability principles
- Designing for desktop and mobile users
- Consistency in design elements
Module 6: Data Storytelling Techniques
- Turning data into narratives
- Communicating insights effectively
- Building logical flow in reports
- Highlighting key insights and trends
- Executive summary reporting techniques
Module 7: Interactive Dashboards and Reporting Tools
- Overview of BI dashboard tools
- Filters, drill-downs, and interactivity features
- Real-time dashboard design considerations
- Automated reporting systems
- Sharing and collaboration features
Module 8: Performance Reporting and Standardization
- Standardizing report formats across teams
- Monthly, quarterly, and annual reporting structures
- Automated reporting workflows
- Version control and report governance
- Ensuring consistency and accuracy
Module 9: Dashboard Optimization and Usability
- Improving dashboard performance and speed
- Reducing clutter and cognitive overload
- User feedback and iterative improvements
- Accessibility and inclusivity in design
- Testing dashboard effectiveness
Module 10: Capstone Project and Case Studies
- Designing a complete BI dashboard system
- Case studies of effective and poor dashboard designs
- Simulation: executive reporting presentation exercise
- Dashboard redesign project for real datasets
- Emerging trends: AI-generated dashboards, natural language reporting, real-time adaptive dashboards, predictive visual analytics, and self-optimizing BI reporting systems