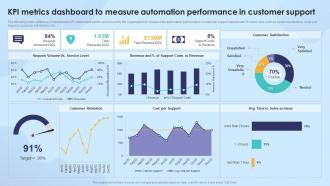
This course equips participants with practical skills to design automated dashboards and build KPI tracking systems that deliver timely, accurate, and actionable insights. It focuses on dashboard planning, KPI selection, data integration, reporting automation, and visualization best practices to improve performance monitoring and decision-making. Participants will learn how to automate recurring reports, connect multiple data sources, and create dynamic dashboards that support operational and strategic goals.
Target Groups
- Business analysts and BI professionals
- Monitoring and evaluation officers
- Finance and operations teams
- Strategy and performance management staff
- Project managers and coordinators
- Department heads and team leaders
- IT and systems support personnel
- NGO and public sector reporting teams
- Anyone responsible for tracking performance and reporting results
Course Objectives
By the end of this course, participants will be able to:
- Understand dashboard and KPI automation principles
- Identify and define meaningful KPIs aligned to organizational goals
- Design dashboards for operational and strategic reporting
- Connect and integrate data from multiple sources
- Automate KPI tracking and recurring reports
- Build interactive and dynamic dashboards
- Apply data visualization best practices
- Monitor performance trends and variances
- Communicate insights effectively to stakeholders
- Strengthen data-driven decision-making processes
Course Modules
Module 1: Introduction to Dashboards & KPI Automation
- Overview of dashboards and KPI automation
- Benefits of automated performance reporting
- Types of dashboards: operational, strategic, and analytical
- Understanding KPI frameworks and performance indicators
- Dashboard planning and reporting requirements
Module 2: Defining KPIs and Performance Metrics
- Identifying critical business indicators
- Aligning KPIs with strategy and objectives
- Leading vs lagging indicators
- Setting KPI targets and thresholds
- KPI ownership and accountability
Module 3: Data Sources and Integration
- Identifying internal and external data sources
- Connecting spreadsheets, databases, and cloud systems
- Data consolidation and integration techniques
- Data quality checks and validation
- Preparing data for automation
Module 4: Dashboard Design and Development
- Dashboard layout and user experience design
- Creating charts, scorecards, and summaries
- Interactive filters and drill-down capabilities
- Designing dashboards for executives and operational teams
- Mobile-friendly and responsive dashboards
Module 5: KPI Automation and Reporting Workflows
- Automating KPI calculations and updates
- Scheduling recurring reports
- Alerts and notifications for threshold changes
- Workflow automation for approvals and reporting cycles
- Managing automated report distribution
Module 6: Data Visualization Best Practices
- Selecting the right visuals for KPIs
- Dashboard readability and clarity
- Highlighting trends and performance gaps
- Visual storytelling with performance data
- Avoiding common dashboard design errors
Module 7: Monitoring and Performance Analysis
- Trend analysis and benchmarking
- Variance analysis and performance reviews
- Identifying root causes and patterns
- Using dashboards for strategic planning
- Decision-making based on KPI insights
Module 8: Governance, Security and Access Control
- Data governance for dashboard reporting
- User roles and access permissions
- Protecting sensitive performance data
- Version control and audit trails
- Compliance and reporting standards
Module 9: Collaboration and Stakeholder Reporting
- Sharing dashboards across teams
- Reporting to leadership and decision-makers
- Cross-functional collaboration using dashboards
- Presenting KPI insights effectively
- Driving accountability through transparent reporting
Module 10: Capstone Project and Case Studies
- Building an automated KPI dashboard from real datasets
- Dashboard automation workflow exercise
- KPI reporting case study and analysis
- Dashboard presentation and peer feedback
- Emerging trends in real-time dashboards, predictive analytics, AI-powered reporting, mobile BI, and enterprise performance management